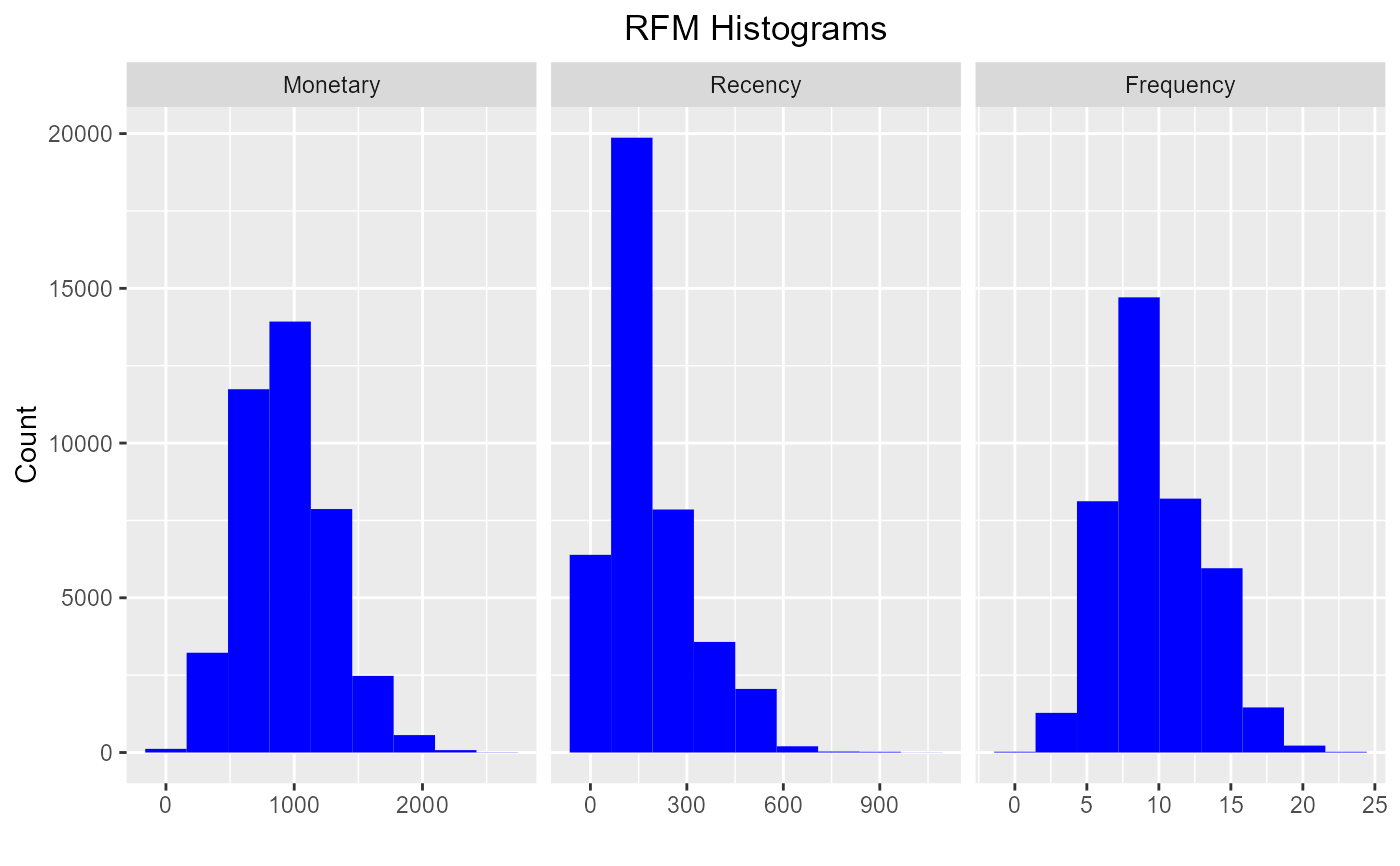
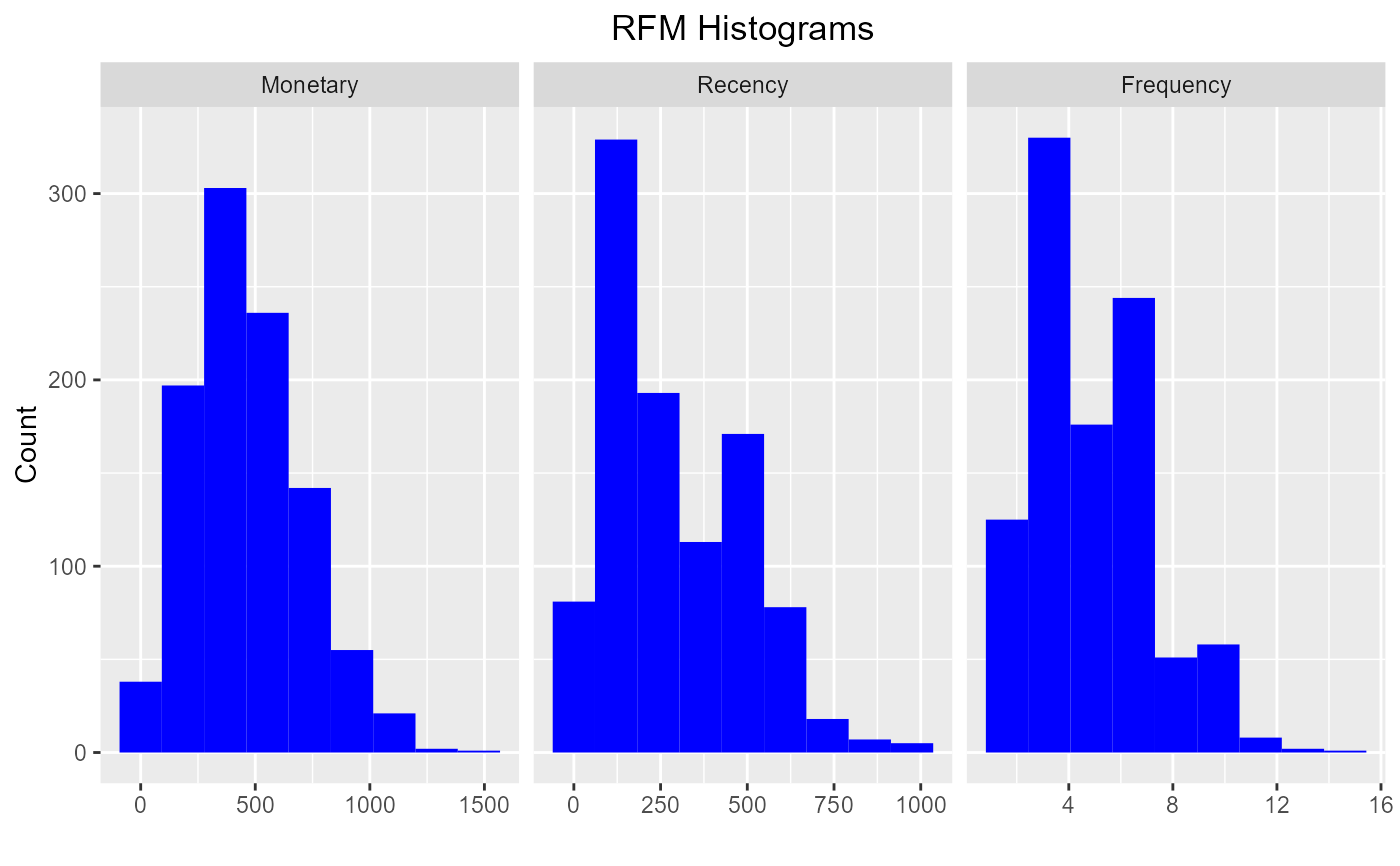
Histograms of recency, frequency and monetary value.
Usage
rfm_histograms(
  rfm_table,
  hist_bins = 9,
  hist_color = "blue",
  plot_title = "RFM Histograms",
  xaxis_title = " ",
  yaxis_title = "Count",
  hist_m_label = "Monetary",
  hist_r_label = "Recency",
  hist_f_label = "Frequency",
  plot_title_justify = 0.5,
  print_plot = TRUE
)
Arguments
- rfm_table
An object of class
rfm_table.- hist_bins
Number of bins of the histograms.
- hist_color
Color of the histogram.
- plot_title
Title of the plot.
- xaxis_title
X axis title.
- yaxis_title
Y axis title.
- hist_m_label
Label of the monetary value histogram.
- hist_r_label
Label of the recency histogram.
- hist_f_label
Label of the frequency histogram.
- plot_title_justify
Horizontal justification of the plot title; 0 for left justified and 1 for right justified.
- print_plot
logical; if
TRUE, prints the plot else returns a plot object.
Examples
# using transaction data
analysis_date <- as.Date('2006-12-31')
rfm_order <- rfm_table_order(rfm_data_orders, customer_id, order_date,
revenue, analysis_date)

# histogram
rfm_histograms(rfm_order)


# using customer data
analysis_date <- as.Date('2007-01-01')
rfm_customer <- rfm_table_customer(rfm_data_customer, customer_id,
number_of_orders, recency_days, revenue, analysis_date)

# histogram
rfm_histograms(rfm_customer)
# using customer data
analysis_date <- as.Date('2007-01-01')
rfm_customer <- rfm_table_customer(rfm_data_customer, customer_id,
number_of_orders, recency_days, revenue, analysis_date)
# histogram
rfm_histograms(rfm_customer)