RFM - Customer Level Data
Aravind Hebbali
2023-05-25
Source:vignettes/rfm-customer-level-data.Rmd
rfm-customer-level-data.RmdIntroduction
RFM (recency, frequency, monetary) analysis is a behavior based technique used to segment customers by examining their transaction history such as
- how recently a customer has purchased (recency)
- how often they purchase (frequency)
- how much the customer spends (monetary)
It is based on the marketing axiom that 80% of your business comes from 20% of your customers. RFM helps to identify customers who are more likely to respond to promotions by segmenting them into various categories.
Data
To calculate the RFM score for each customer we need transaction data which should include the following:
- a unique customer id
- number of transaction/order
- total revenue from the customer
- number of days since the last visit
rfm includes a sample data set
rfm_data_orders which includes the above details:
rfm_data_customer## # A tibble: 39,999 x 5
## customer_id revenue most_recent_visit number_of_orders recency_days
## <dbl> <dbl> <date> <dbl> <dbl>
## 1 22086 777 2006-05-14 9 232
## 2 2290 1555 2006-09-08 16 115
## 3 26377 336 2006-11-19 5 43
## 4 24650 1189 2006-10-29 12 64
## 5 12883 1229 2006-12-09 12 23
## 6 2119 929 2006-10-21 11 72
## 7 31283 1569 2006-09-11 17 112
## 8 33815 778 2006-08-12 11 142
## 9 15972 641 2006-11-19 9 43
## 10 27650 970 2006-08-23 10 131
## # i 39,989 more rowsRFM Score
So how is the RFM score computed for each customer? The below steps explain the process:
A recency score is assigned to each customer based on date of most recent purchase. The score is generated by binning the recency values into a number of categories (default is 5). For example, if you use four categories, the customers with the most recent purchase dates receive a recency ranking of 4, and those with purchase dates in the distant past receive a recency ranking of 1.
A frequency ranking is assigned in a similar way. Customers with high purchase frequency are assigned a higher score (4 or 5) and those with lowest frequency are assigned a score 1.
Monetary score is assigned on the basis of the total revenue generated by the customer in the period under consideration for the analysis. Customers with highest revenue/order amount are assigned a higher score while those with lowest revenue are assigned a score of 1.
A fourth score, RFM score is generated which is simply the three individual scores concatenated into a single value.
The customers with the highest RFM scores are most likely to respond
to an offer. Now that we have understood how the RFM score is computed,
it is time to put it into practice. Use rfm_table_order()
to generate the score for each customer from the sample data set
rfm_data_orders.
rfm_table_order() takes 8 inputs:
-
data: a data set with- unique customer id
- date of transaction
- and amount
-
customer_id: name of the customer id column -
order_date: name of the transaction date column -
revenue: name of the transaction amount column -
analysis_date: date of analysis -
recency_bins: number of rankings for recency score (default is 5) -
frequency_bins: number of rankings for frequency score (default is 5) -
monetary_bins: number of rankings for monetary score (default is 5)
RFM Table
analysis_date <- as.Date('2007-01-01')
rfm_result <- rfm_table_customer(rfm_data_customer, customer_id, number_of_orders,
  recency_days, revenue, analysis_date)
rfm_result| customer_id | recency_days | transaction_count | amount | recency_score | frequency_score | monetary_score | rfm_score |
|---|---|---|---|---|---|---|---|
| 22086 | 232 | 9 | 777 | 2 | 2 | 2 | 222 |
| 2290 | 115 | 16 | 1555 | 4 | 5 | 5 | 455 |
| 26377 | 43 | 5 | 336 | 5 | 1 | 1 | 511 |
| 24650 | 64 | 12 | 1189 | 5 | 4 | 4 | 544 |
| 12883 | 23 | 12 | 1229 | 5 | 4 | 5 | 545 |
| 2119 | 72 | 11 | 929 | 5 | 4 | 3 | 543 |
| 31283 | 112 | 17 | 1569 | 4 | 5 | 5 | 455 |
| 33815 | 142 | 11 | 778 | 3 | 4 | 2 | 342 |
| 15972 | 43 | 9 | 641 | 5 | 2 | 2 | 522 |
| 27650 | 131 | 10 | 970 | 3 | 3 | 3 | 333 |
rfm_table_customer() will return the following columns
as seen in the above table:
-
customer_id: unique customer id -
date_most_recent: date of most recent visit -
recency_days: days since the most recent visit -
transaction_count: number of transactions of the customer -
amount: total revenue generated by the customer -
recency_score: recency score of the customer -
frequency_score: frequency score of the customer -
monetary_score: monetary score of the customer -
rfm_score: RFM score of the customer
Heat Map
The heat map shows the average monetary value for different categories of recency and frequency scores. Higher scores of frequency and recency are characterized by higher average monetary value as indicated by the darker areas in the heatmap.
rfm_plot_heatmap(rfm_result)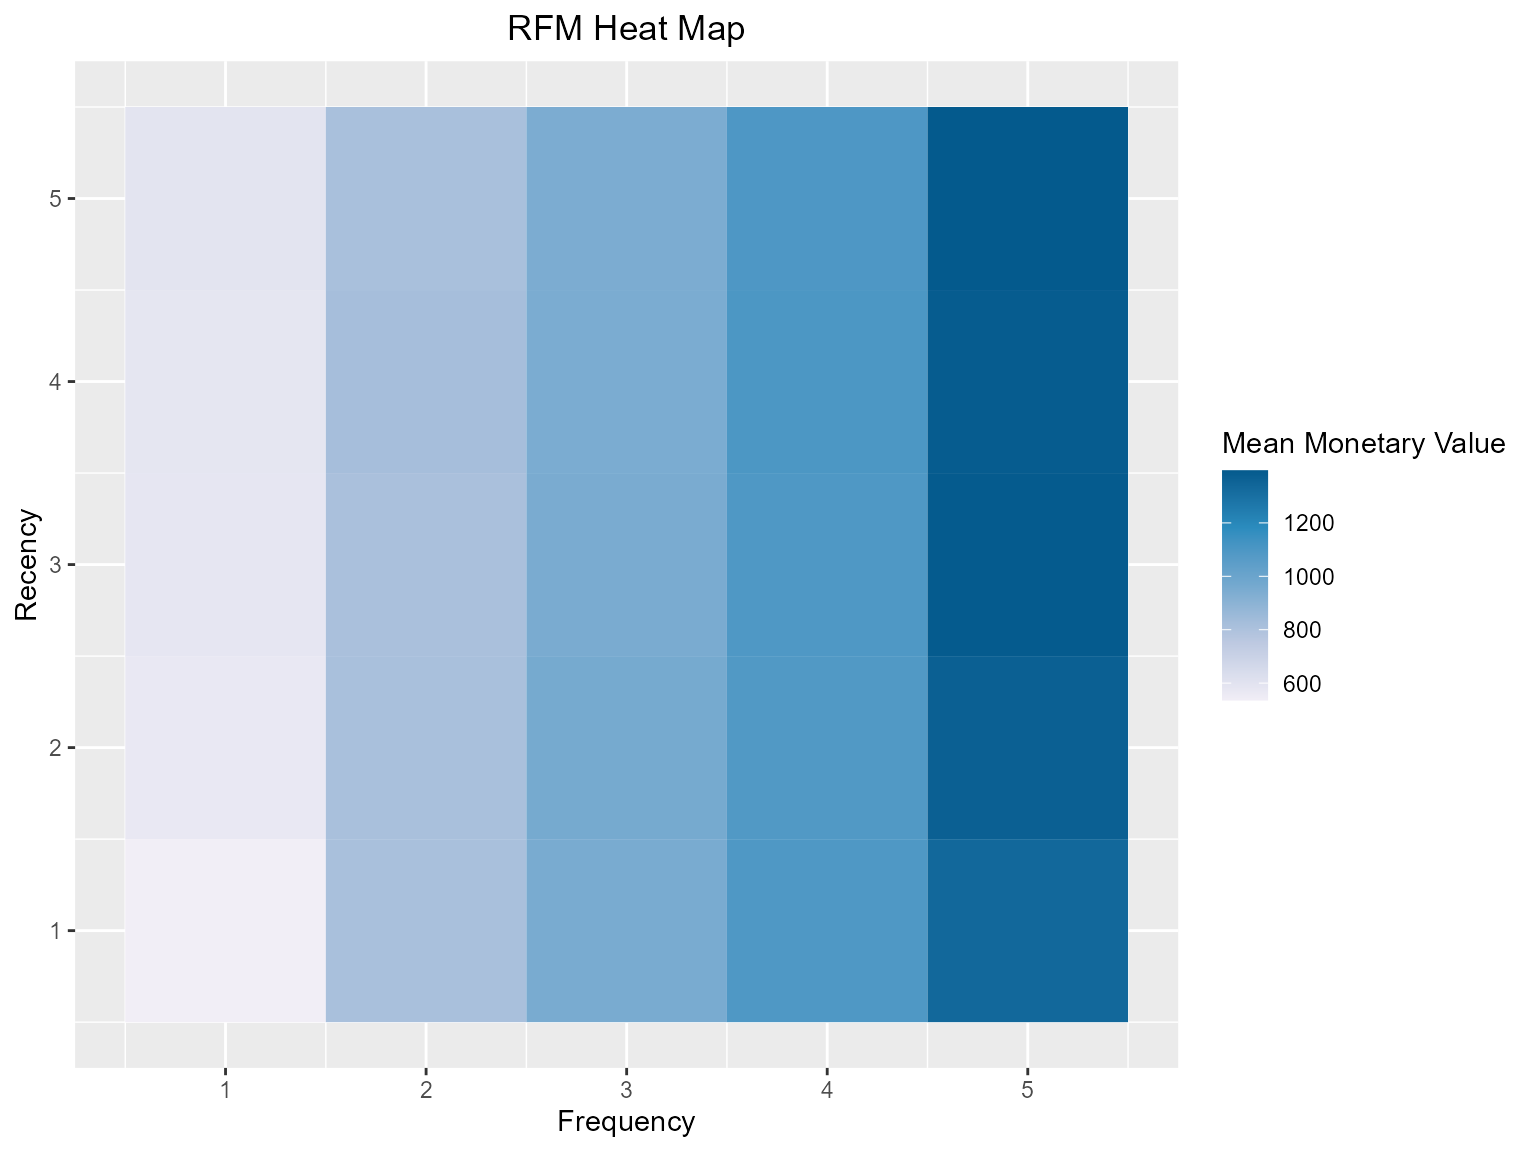
Bar Chart
Use rfm_bar_chart() to generate the distribution of
monetary scores for the different combinations of frequency and recency
scores.
rfm_plot_bar_chart(rfm_result)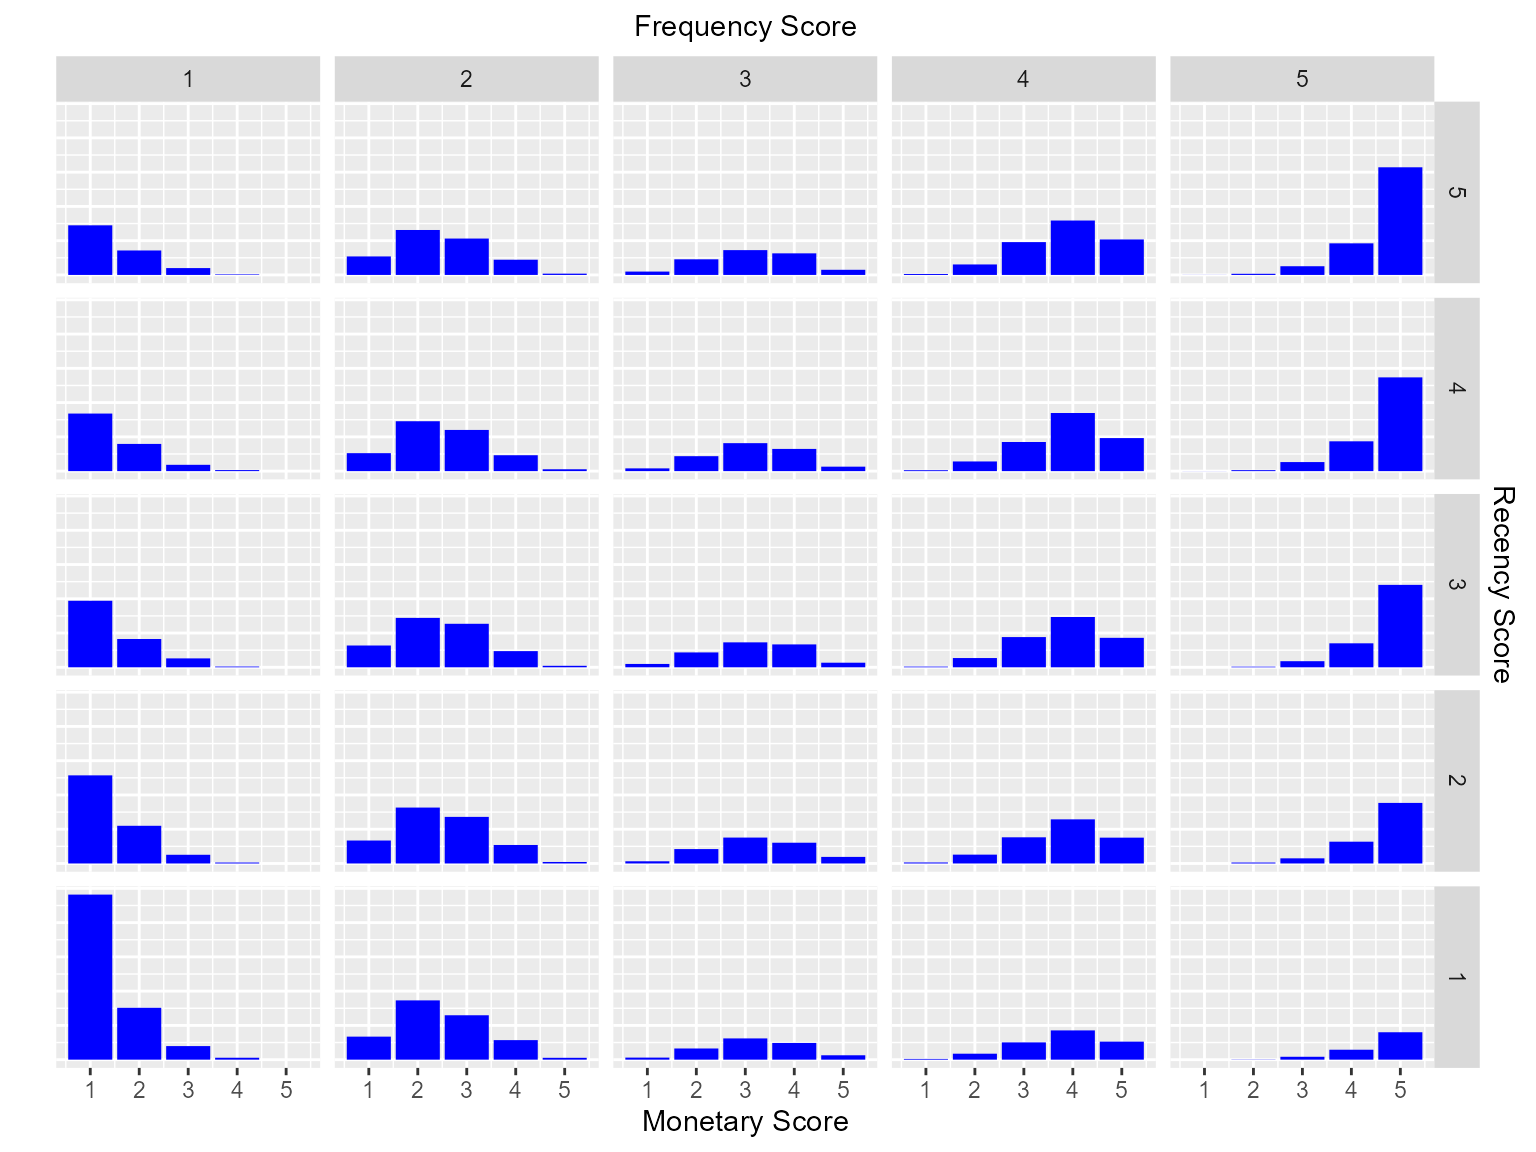
Histogram
Use rfm_histograms() to examine the relative
distribution of
- monetary value (total revenue generated by each customer)
- recency days (days since the most recent visit for each customer)
- frequency (transaction count for each customer)
rfm_plot_histograms(rfm_result)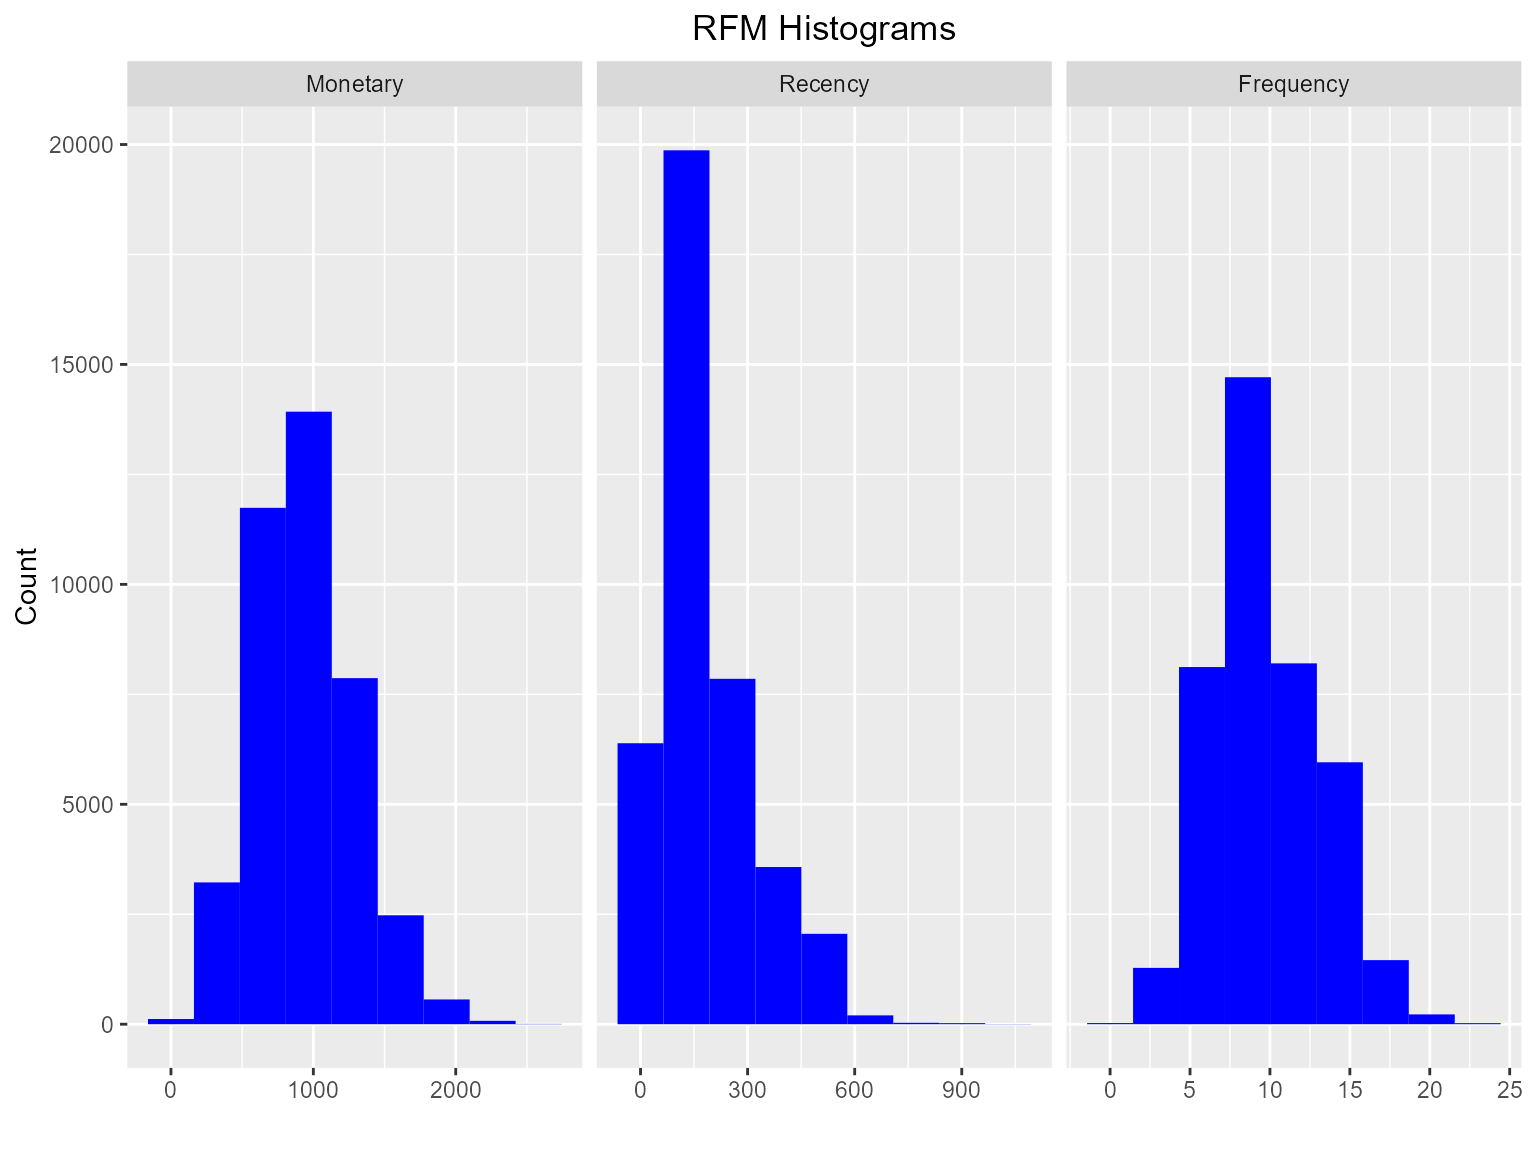
Customers by Orders
Visualize the distribution of customers across orders.
rfm_plot_order_dist(rfm_result)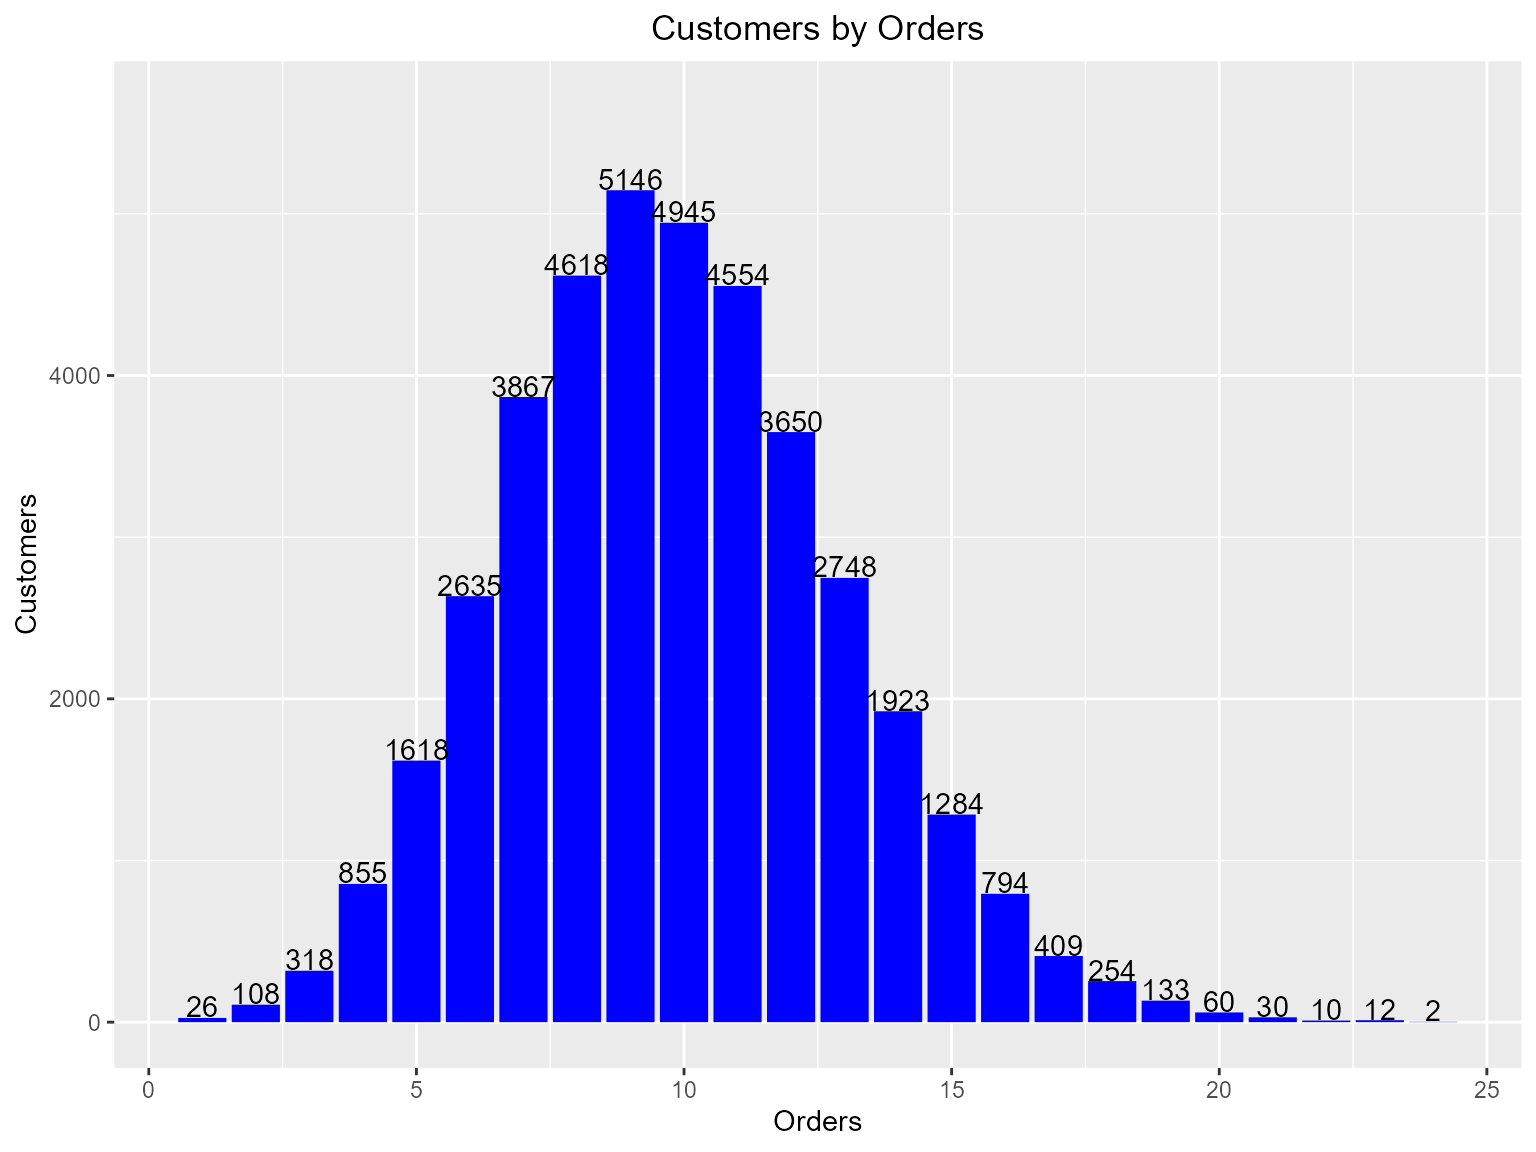
Segments
Let us classify our customers based on the individual recency, frequency and monetary scores.
| Segment | Description | R | F | M |
|---|---|---|---|---|
| Champions | Bought recently, buy often and spend the most | 5 | 5 | 5 |
| Potential Loyalist | Recent customers, spent good amount, bought more than once | 3 - 5 | 3 - 5 | 2 - 5 |
| Loyal Customers | Spend good money. Responsive to promotions | 2 - 4 | 2 - 4 | 2 - 4 |
| Promising | Recent shoppers, but haven’t spent much | 3 - 4 | 1 - 3 | 3 - 5 |
| New Customers | Bought more recently, but not often | 4 - 5 | 1 - 3 | 1 - 5 |
| Can’t Lose Them | Made big purchases and often, but long time ago | 1 - 2 | 3 - 4 | 4 - 5 |
| At Risk | Spent big money, purchased often but long time ago | 1 - 2 | 2 - 5 | 4 - 5 |
| Need Attention | Above average recency, frequency & monetary values | 1 - 3 | 3 - 5 | 3 - 5 |
| About To Sleep | Below average recency, frequency & monetary values | 2 - 3 | 1 - 3 | 1 - 4 |
| Lost | Bought a long time ago, average amount spent | 1 - 1 | 1 - 5 | 1 - 5 |
Segmented Customer Data
We can use the segmented data to identify
- best customers
- loyal customers
- at risk customers
- and lost customers
Once we have classified a customer into a particular segment, we can take appropriate action to increase his/her lifetime value.
## Warning in instance$preRenderHook(instance): It seems your data is too big for
## client-side DataTables. You may consider server-side processing:
## https://rstudio.github.io/DT/server.html
Segment Size
Now that we have defined and segmented our customers, let us examine
the distribution of customers across the segments. Ideally, we should
have very few or no customer in segments such as At Risk or
Needs Attention.
## Segment Count
## 1 Potential Loyalist 12762
## 2 Loyal Customers 6965
## 3 Lost 5535
## 4 New Customers 4475
## 5 About To Sleep 4095
## 6 At Risk 2081
## 7 Champions 1571
## 8 Can't Lose Them 1471
## 9 Need Attention 679
## 10 Promising 297
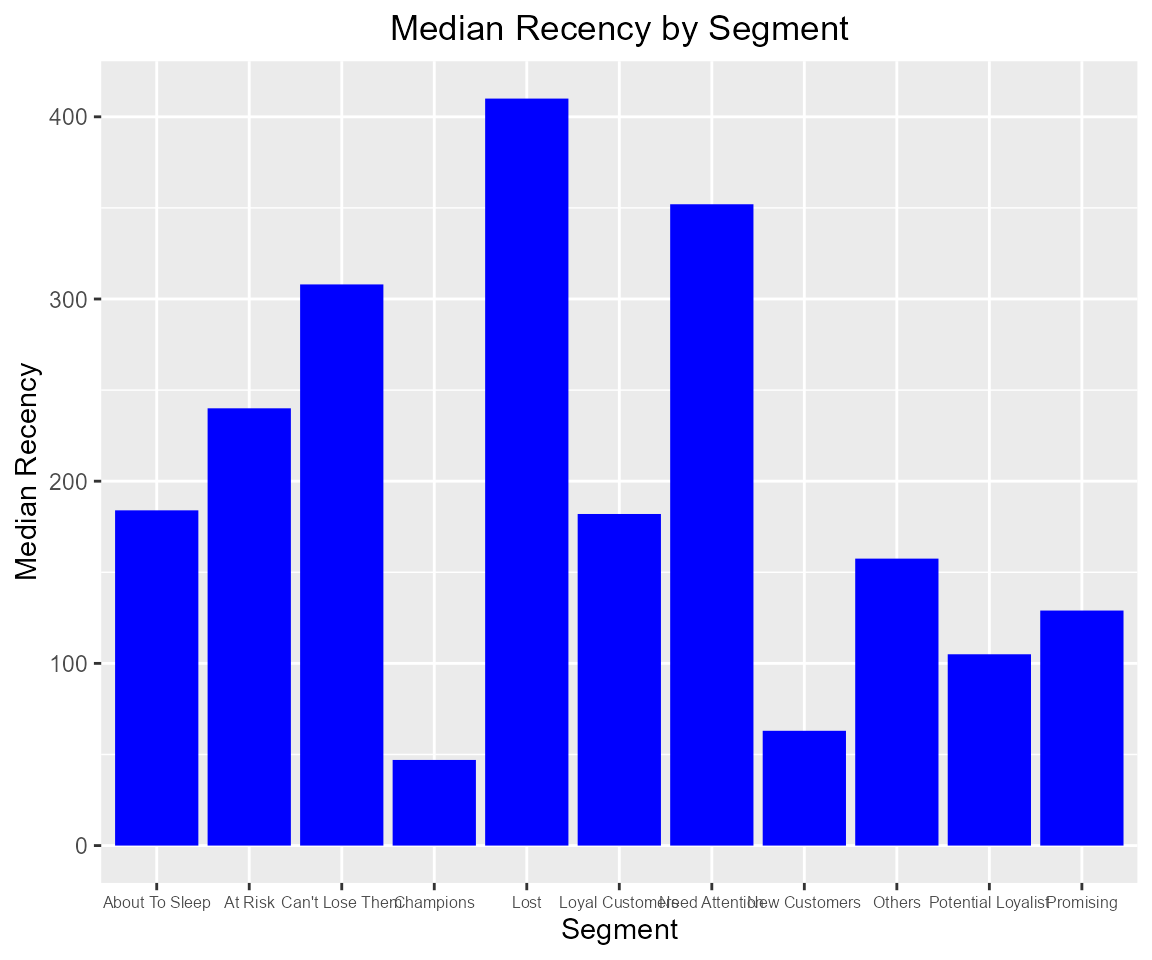
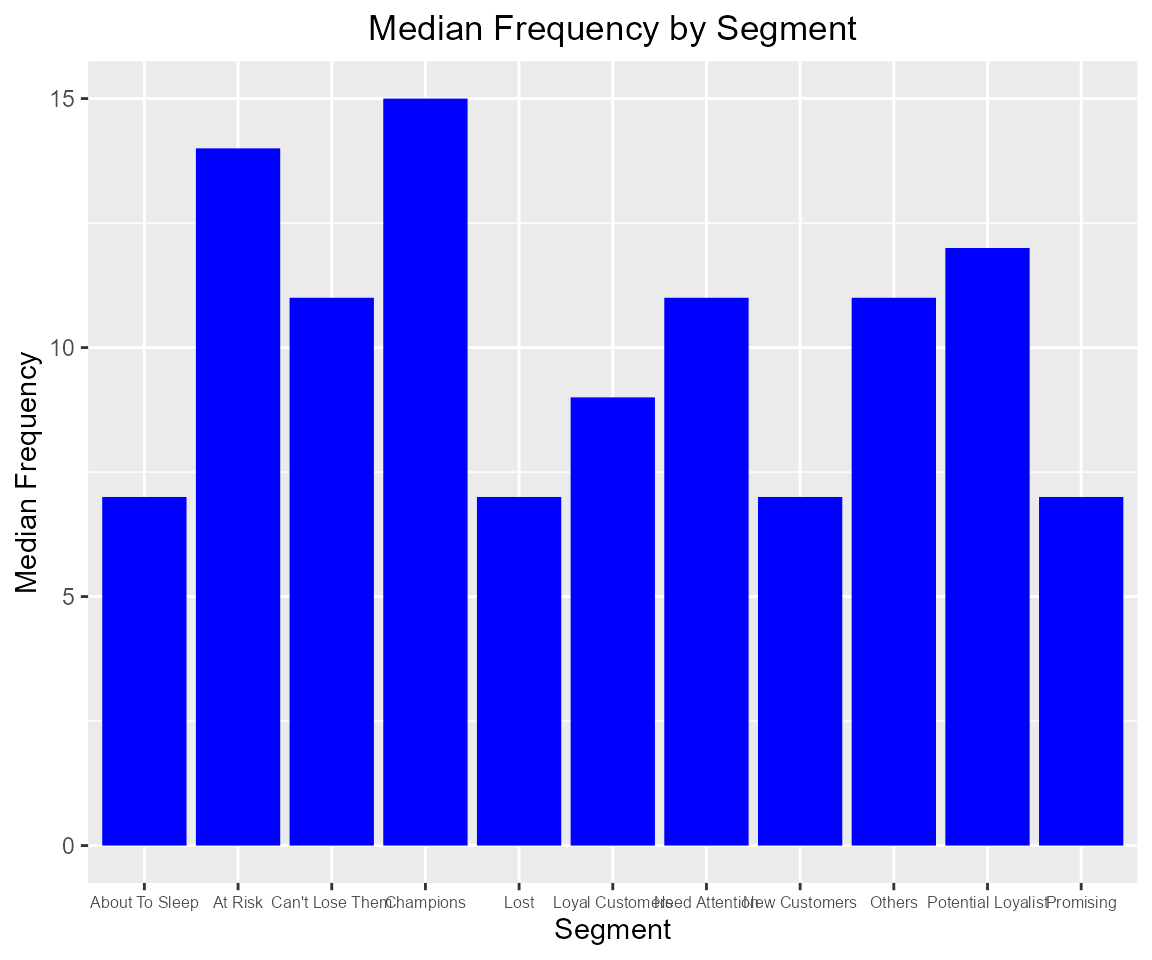
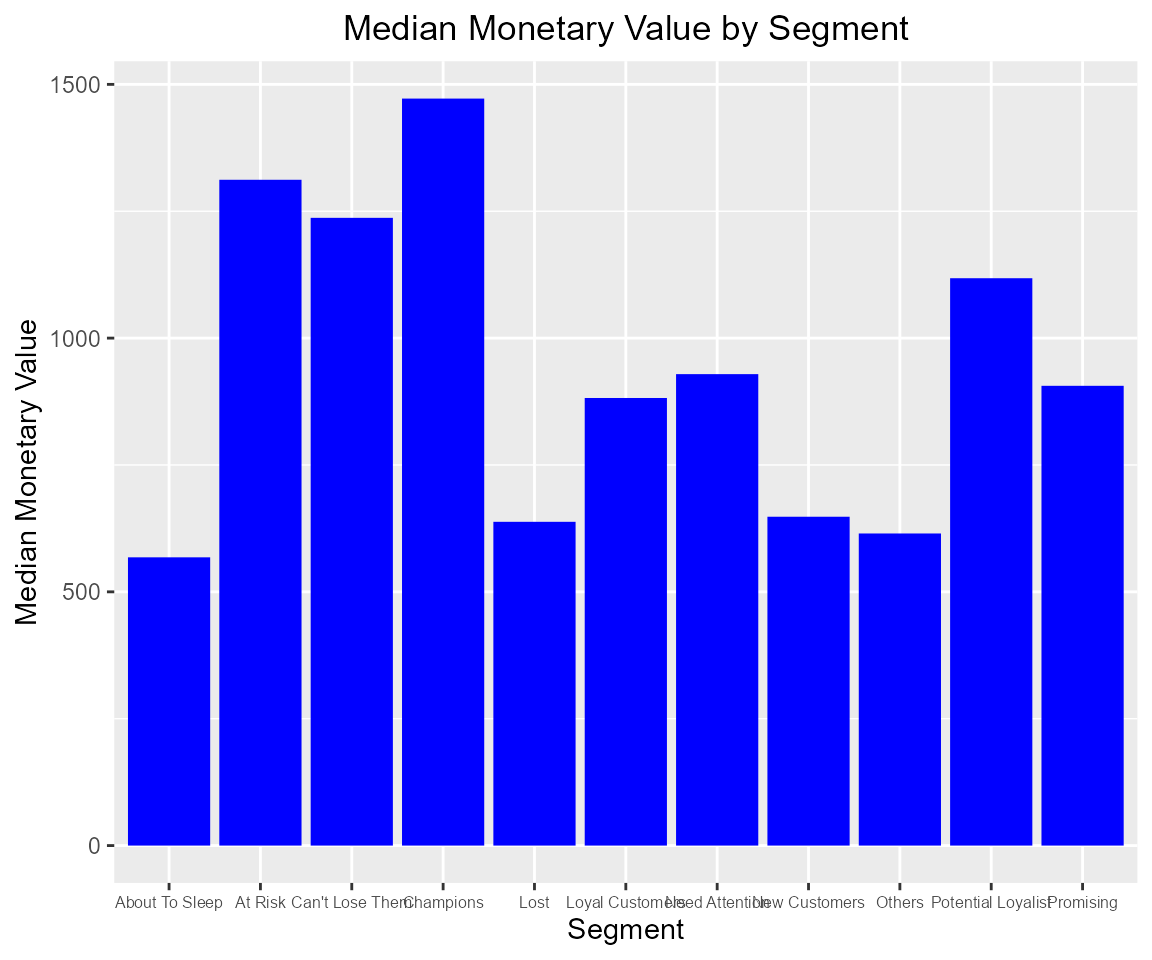
## 11 Others 68We can also examine the median recency, frequency and monetary value across segments to ensure that the logic used for customer classification is sound and practical.
Scatter Plots
The best customers are those who:
- bought most recently
- most often
- and spend the most
Now let us examine the relationship between the above.
Recency vs Monetary Value
Customers who visited more recently generated more revenue compared to those who visited in the distant past. The customers who visited in the recent past are more likely to return compared to those who visited long time ago as most of those would be lost customers. As such, higher revenue would be associated with most recent visits.
rfm_plot_segment_scatter(segments, "monetary", "recency")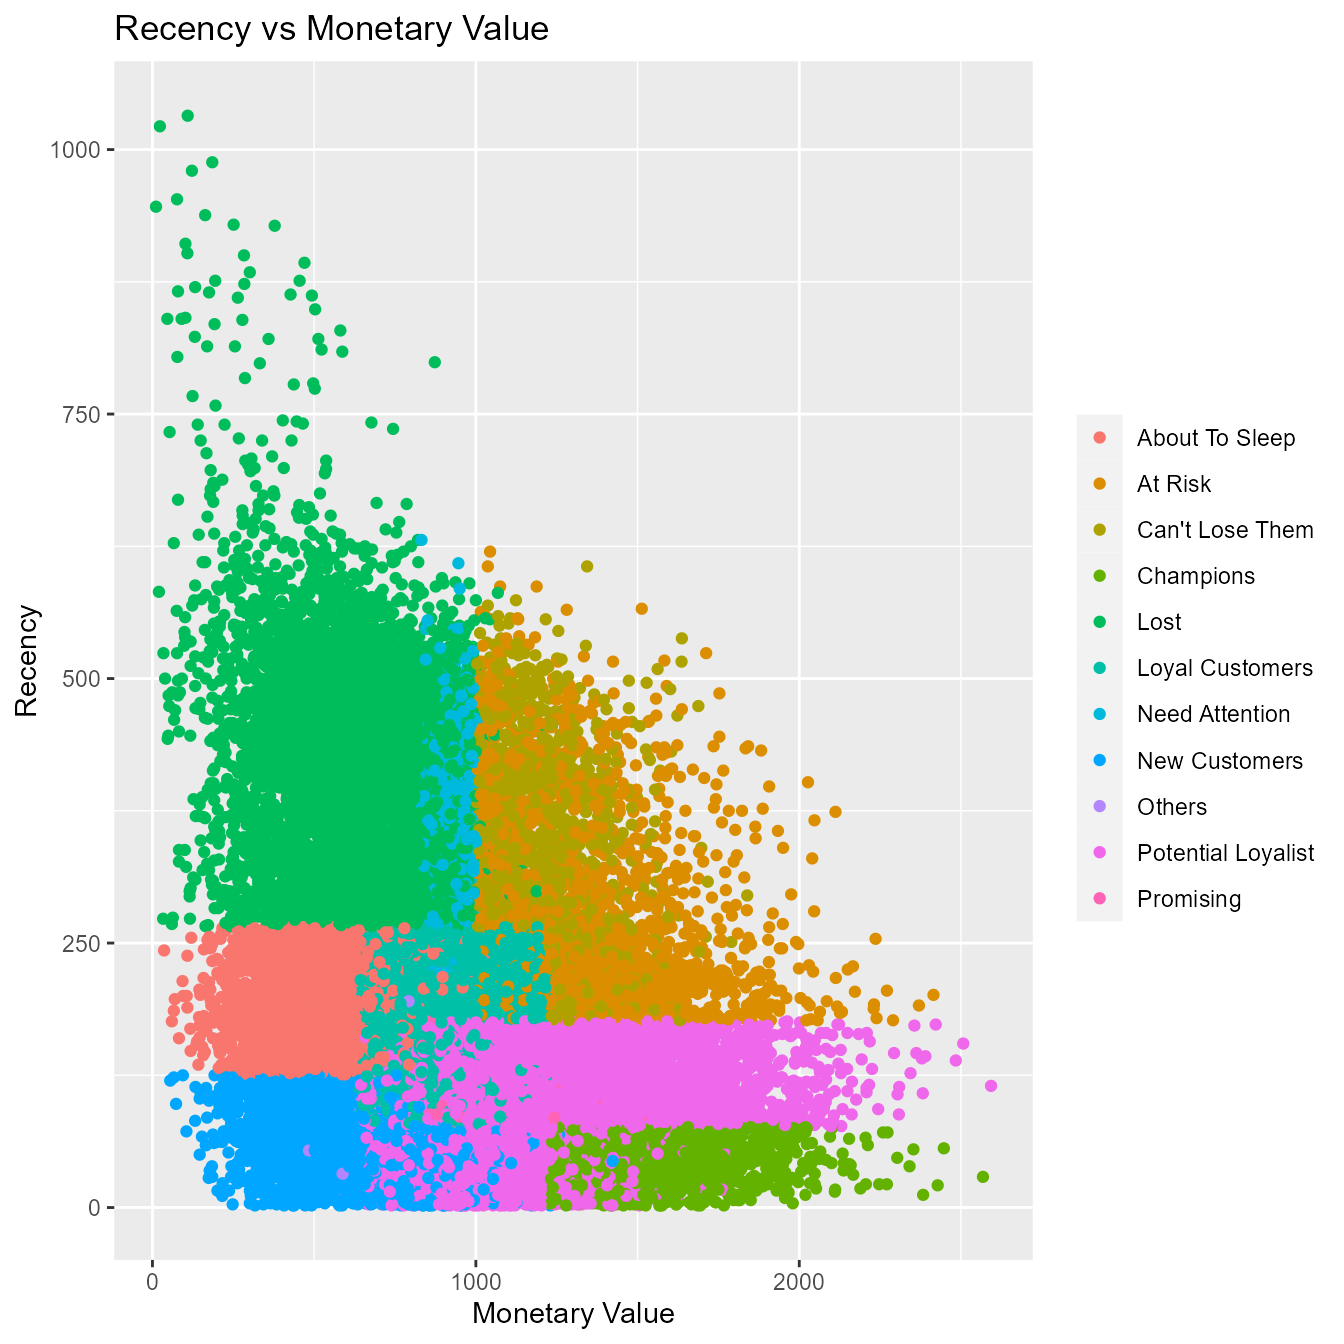
Frequency vs Monetary Value
As the frequency of visits increases, the revenue generated also increases. Customers who visit more frquently are your champion customers, loyal customers or potential loyalists and they drive higher revenue.
rfm_plot_segment_scatter(segments, "monetary", "frequency")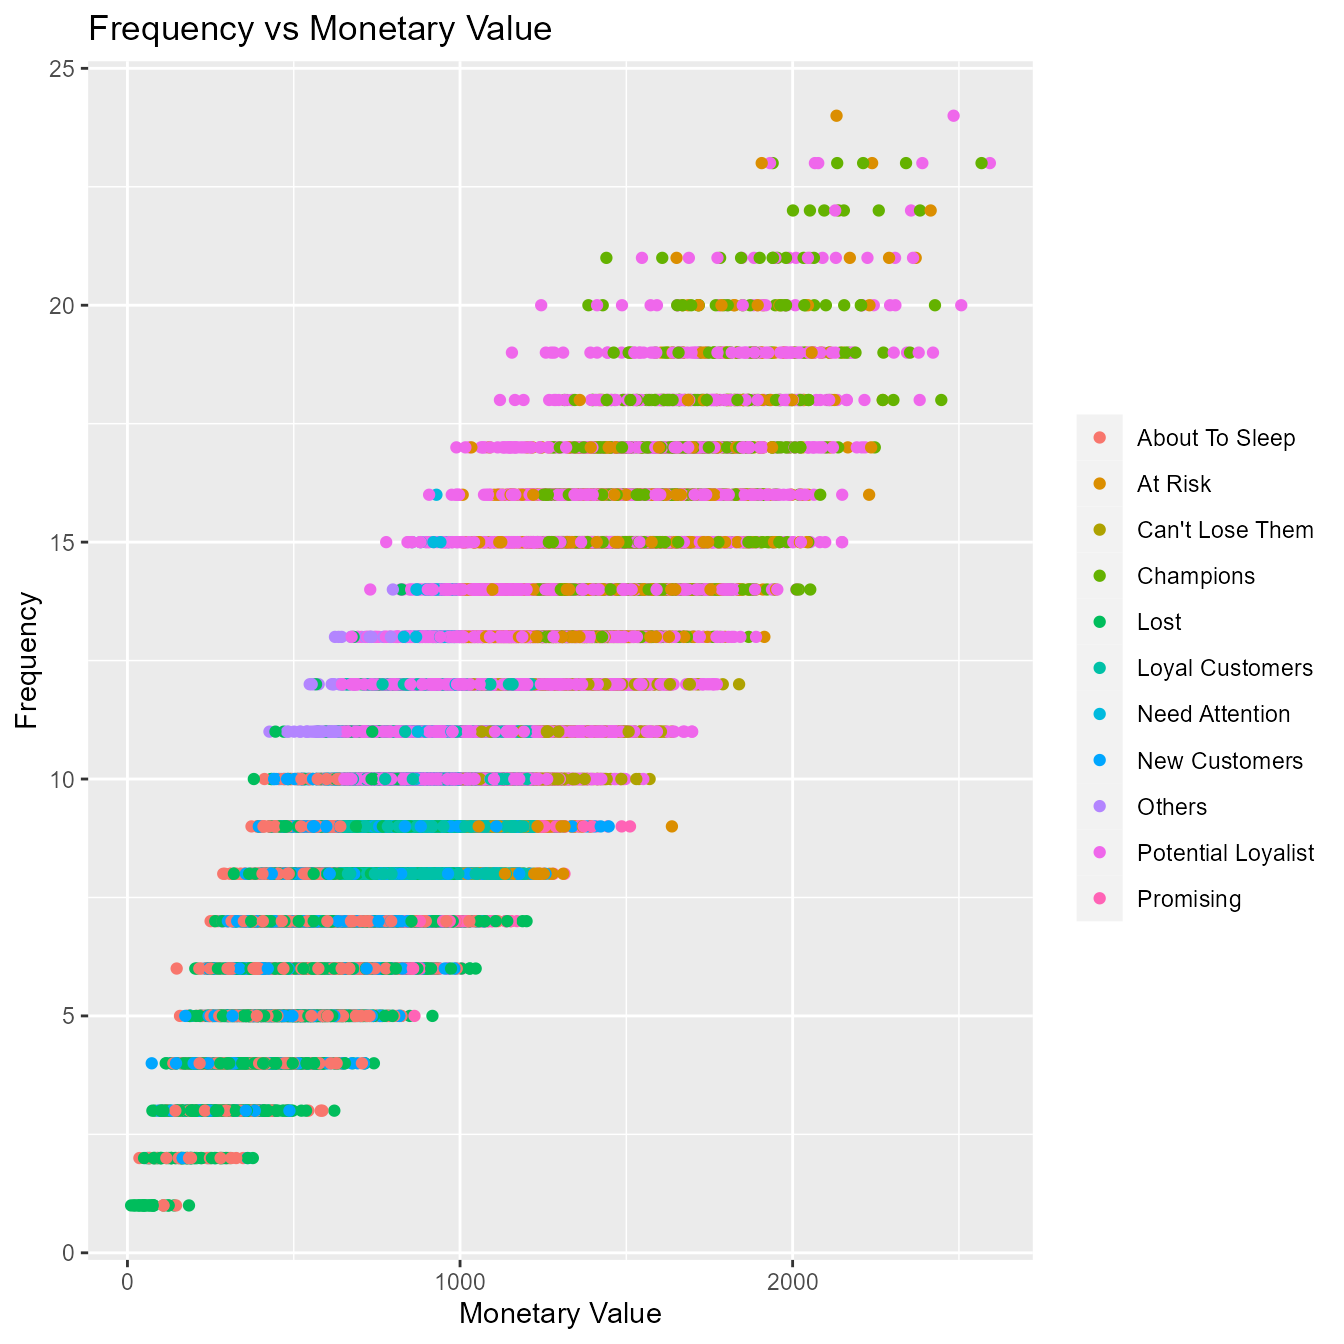
Recency vs Frequency
Customers with low frequency visited in the distant past while those with high frequency have visited in the recent past. Again, the customers who visited in the recent past are more likely to return compared to those who visited long time ago. As such, higher frequency would be associated with the most recent visits.
rfm_plot_segment_scatter(segments, "frequency", "recency")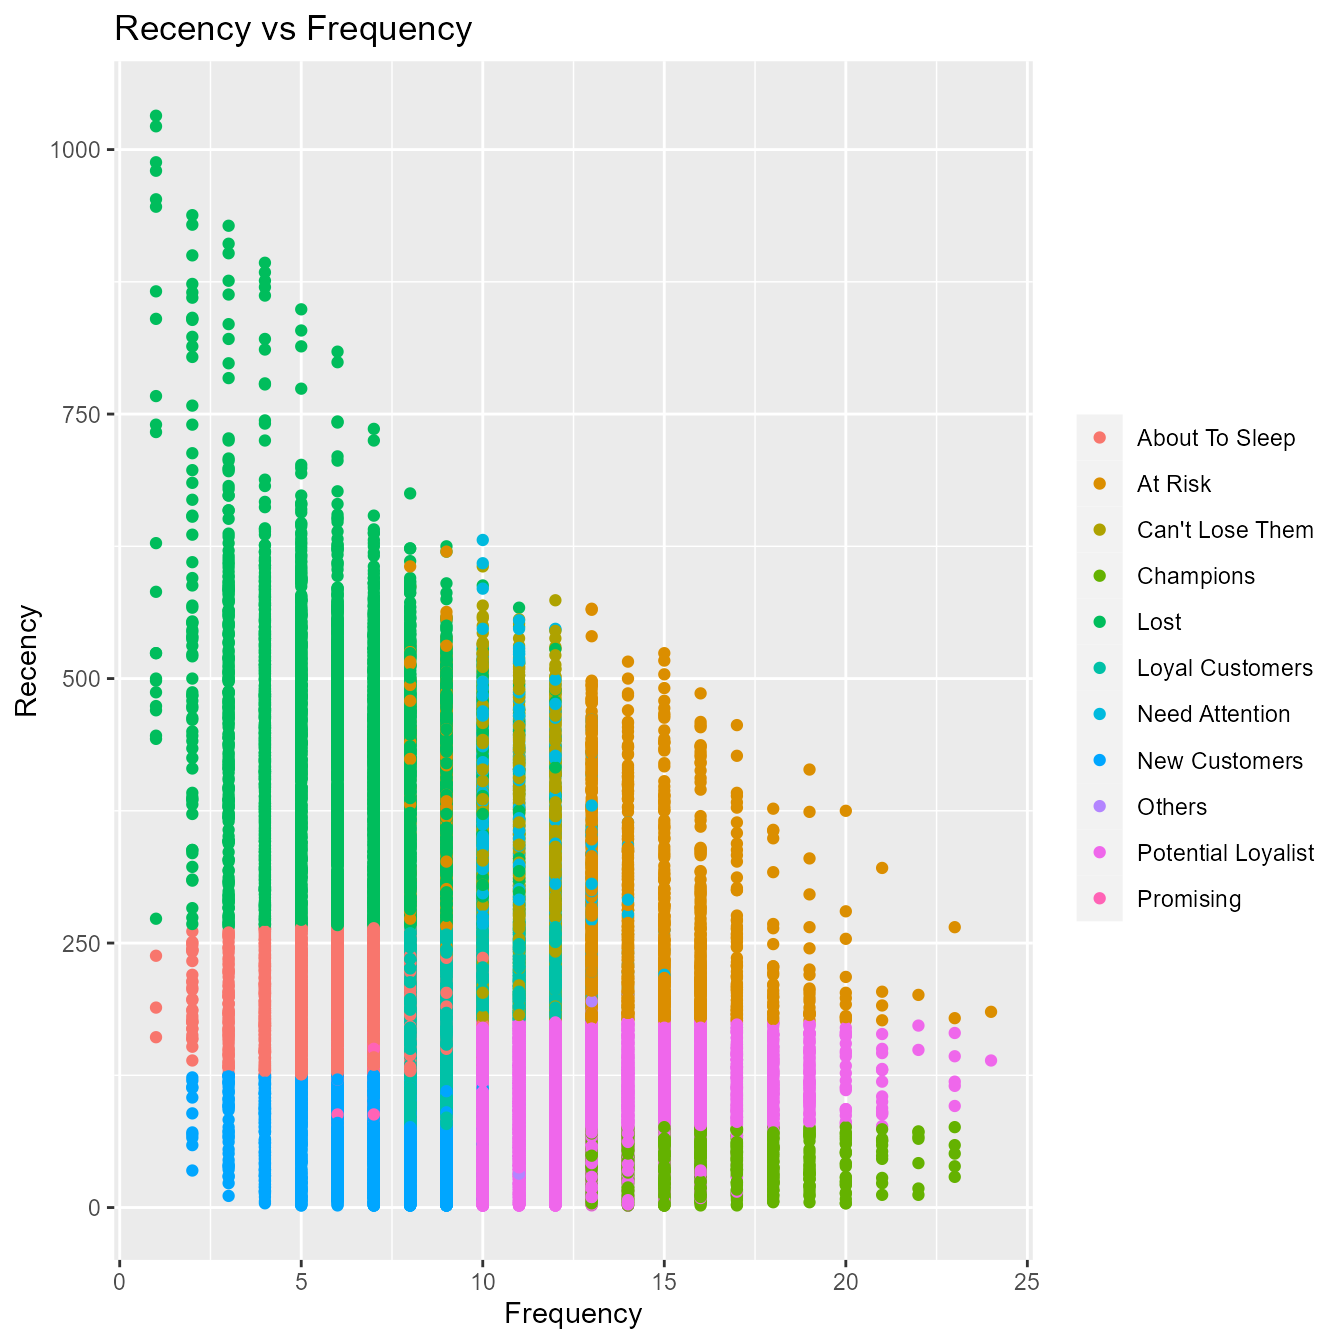
References
- Data Mining: Concepts and Techniques , Second Edition , Jiawei Han University of Illinois at Urbana-Champaign Micheline Kamber.
- https://joaocorreia.io/blog/rfm-analysis-increase-sales-by-segmenting-your-customers.html
- https://www.sciencedirect.com/science/article/pii/S1877050910003868