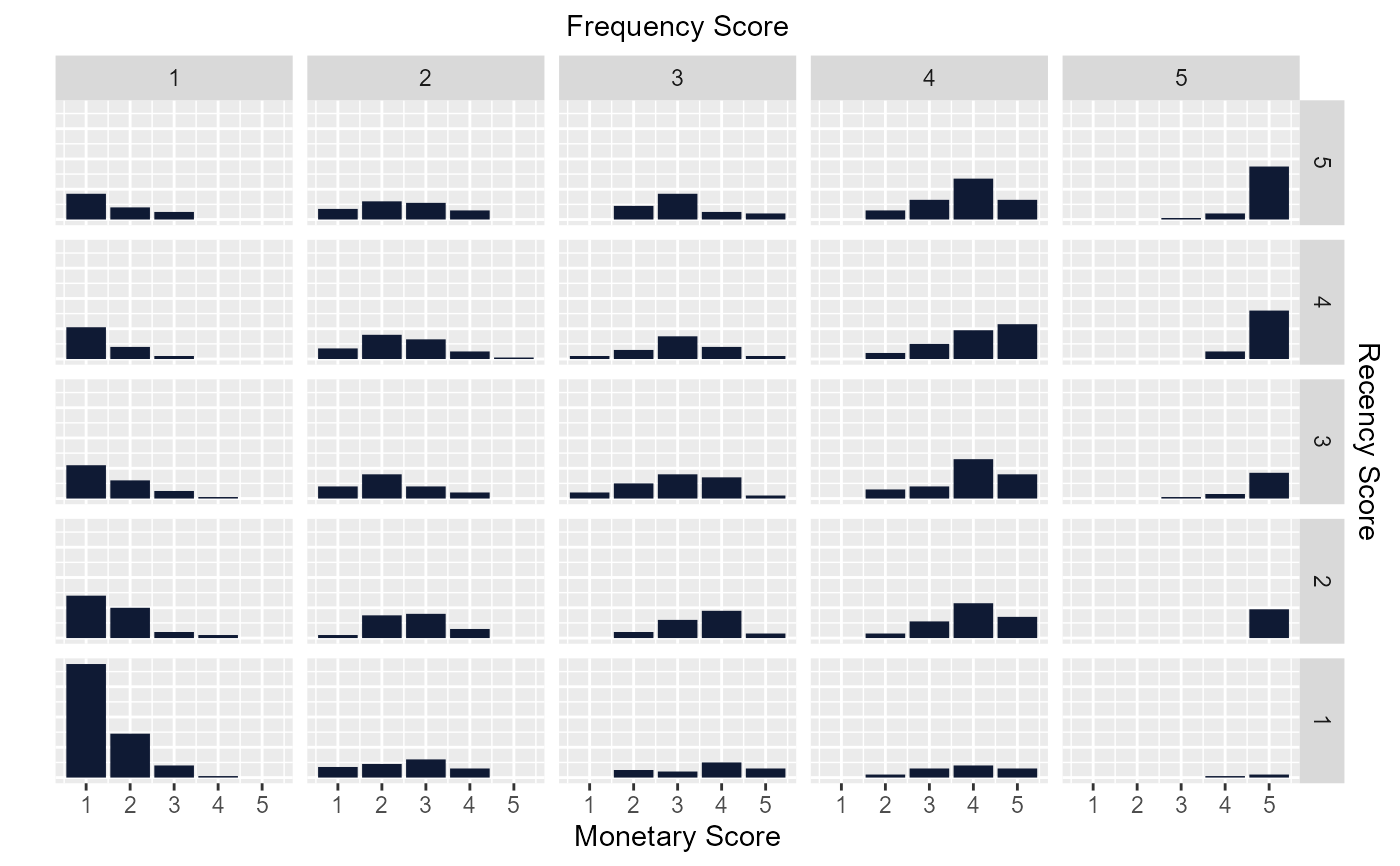
Examine the distribution of monetary scores for the different combinations of frequency and recency scores.
Usage
rfm_plot_bar_chart(
  rfm_table,
  bar_color = NULL,
  xaxis_label = NULL,
  sec_xaxis_label = NULL,
  yaxis_label = NULL,
  sec_yaxis_label = NULL,
  print_plot = TRUE
)Deprecated Functions
rfm_bar_chart() has been deprecated and will be made defunct. It has
been provided for compatibility with older versions only, and will be made
defunct at the next release.
Instead use the replacement function rfm_plot_bar_chart().
Examples
# using transaction data
analysis_date <- as.Date('2006-12-31')
rfm_order <- rfm_table_order(rfm_data_orders, customer_id, order_date,
revenue, analysis_date)

# bar chart
rfm_plot_bar_chart(rfm_order)