RFM - Introduction
Aravind Hebbali
2024-02-26
Source:../../../../R/Packages/statistics/rfm/vignettes/rfm-introduction.Rmd
rfm-introduction.RmdIntroduction
This article provides a brief introduction to RFM analysis and customer segmentation. If you are looking for a detailed guide, check out our free online course or YouTube tutorial or blog post.
RFM (recency, frequency, monetary) analysis is a behavior based technique used to segment customers by examining their transaction history such as
- how recently a customer has purchased (recency)
- how often they purchase (frequency)
- how much the customer spends (monetary)
It is based on the marketing axiom that 80% of your business comes from 20% of your customers. RFM helps to identify customers who are more likely to respond to promotions by segmenting them into various categories.
Data
To calculate the RFM score for each customer we need data for a particular time frame and should include the following:
- a unique customer id
- date of transaction/order
- transaction/order amount
Data can be at customer level or transaction level i.e. each row in
the data may represent a single transaction of a customer or summary of
all transactions of a customer. rfm package includes two
sample data sets:
rfm_data_orders
head(rfm_data_orders)## customer_id order_date revenue first_name last_name
## 1 Brion Stark 2004-12-20 32 Brion Stark
## 2 Ethyl Botsford 2005-05-02 36 Ethyl Botsford
## 3 Hosteen Jacobi 2004-03-06 116 Hosteen Jacobi
## 4 Edw Frami 2006-03-15 99 Edw Frami
## 5 Josef Lemke 2006-08-14 76 Josef Lemke
## 6 Julisa Halvorson 2005-05-28 56 Julisa Halvorson
## email
## 1 brion_stark@rfmail.com
## 2 ethyl_botsford@rfmail.com
## 3 hosteen_jacobi@rfmail.com
## 4 edw_frami@rfmail.com
## 5 josef_lemke@rfmail.com
## 6 julisa_halvorson@rfmail.comrfm_data_customer
head(rfm_data_customer)## customer_id revenue most_recent_visit number_of_orders recency_days
## 1 22086 777 2006-05-14 9 232
## 2 2290 1555 2006-09-08 16 115
## 3 26377 336 2006-11-19 5 43
## 4 24650 1189 2006-10-29 12 64
## 5 12883 1229 2006-12-09 12 23
## 6 2119 929 2006-10-21 11 72
## first_name last_name email
## 1 Maddalena Erie merie0@go.com
## 2 Bradley Sesser bsesser1@time.com
## 3 Gwenora Asser gasser2@issuu.com
## 4 Hendrick Josh hjosh3@ed.gov
## 5 Cathleen Musterd cmusterd4@hc360.com
## 6 Norrie Brear nbrear5@techcrunch.comYou can take a look at them to understand the difference between customer and transaction level data. Remember, the data sets are different and the final results will not match.
RFM Score
So how is the RFM score computed for each customer? The below steps explain the process:
A recency score is assigned to each customer based on date of most recent purchase. The score is generated by binning the recency values into a number of categories (default is 5). For example, if you use four categories, the customers with the most recent purchase dates receive a recency ranking of 4, and those with purchase dates in the distant past receive a recency ranking of 1.
A frequency ranking is assigned in a similar way. Customers with high purchase frequency are assigned a higher score (4 or 5) and those with lowest frequency are assigned a score 1.
Monetary score is assigned on the basis of the total revenue generated by the customer in the period under consideration for the analysis. Customers with highest revenue/order amount are assigned a higher score while those with lowest revenue are assigned a score of 1.
A fourth score, RFM score is generated which is simply the three individual scores concatenated into a single value.
The customers with the highest RFM scores are most likely to respond
to an offer. Now that we have understood how the RFM score is computed,
it is time to put it into practice. Use rfm_table_order()
to generate the score for each customer from the sample data set
rfm_data_orders.
analysis_date <- as.Date("2006-12-31")
rfm_result <- rfm_table_order(rfm_data_orders, customer_id, order_date, revenue, analysis_date)
rfm_result| customer_id | recency_days | transaction_count | amount | rfm_score | recency_score | frequency_score | monetary_score | first_name | last_name | |
|---|---|---|---|---|---|---|---|---|---|---|
| Abbey O’Reilly | 205 | 6 | 472 | 343 | 3 | 4 | 3 | Abbey | O’Reilly | abbey_o'reilly@rfmail.com |
| Add Senger | 140 | 3 | 340 | 412 | 4 | 1 | 2 | Add | Senger | add_senger@rfmail.com |
| Aden Lesch | 194 | 4 | 405 | 323 | 3 | 2 | 3 | Aden | Lesch | aden_lesch@rfmail.com |
| Aden Murphy | 98 | 7 | 596 | 544 | 5 | 4 | 4 | Aden | Murphy | aden_murphy@rfmail.com |
| Admiral Senger | 132 | 5 | 448 | 433 | 4 | 3 | 3 | Admiral | Senger | admiral_senger@rfmail.com |
| Agness O’Keefe | 90 | 9 | 843 | 555 | 5 | 5 | 5 | Agness | O’Keefe | agness_o'keefe@rfmail.com |
| Aileen Barton | 84 | 9 | 763 | 555 | 5 | 5 | 5 | Aileen | Barton | aileen_barton@rfmail.com |
| Ailene Hermann | 281 | 8 | 699 | 355 | 3 | 5 | 5 | Ailene | Hermann | ailene_hermann@rfmail.com |
| Aiyanna Bruen | 246 | 4 | 157 | 321 | 3 | 2 | 1 | Aiyanna | Bruen | aiyanna_bruen@rfmail.com |
| Akeelah Walsh | 160 | 7 | 779 | 445 | 4 | 4 | 5 | Akeelah | Walsh | akeelah_walsh@rfmail.com |
Segments
Let us segment our customers based on the individual recency, frequency and monetary scores. Keep in mind that creating segments based on RFM score is a very subjective endeavour. Having good business and domain knowledge will allow the user to generate effective segments. There is no one size fits all solution here.
| Segment | Description | R | F | M |
|---|---|---|---|---|
| Champions | Bought recently, buy often and spend the most | 5 | 5 | 5 |
| Potential Loyalist | Recent customers, spent good amount, bought more than once | 3 - 5 | 3 - 5 | 2 - 5 |
| Loyal Customers | Spend good money. Responsive to promotions | 2 - 4 | 2 - 4 | 2 - 4 |
| Promising | Recent shoppers, but haven’t spent much | 3 - 4 | 1 - 3 | 3 - 5 |
| New Customers | Bought more recently, but not often | 4 - 5 | 1 - 3 | 1 - 5 |
| Can’t Lose Them | Made big purchases and often, but long time ago | 1 - 2 | 3 - 4 | 4 - 5 |
| At Risk | Spent big money, purchased often but long time ago | 1 - 2 | 2 - 5 | 4 - 5 |
| Need Attention | Above average recency, frequency & monetary values | 1 - 3 | 3 - 5 | 3 - 5 |
| About To Sleep | Below average recency, frequency & monetary values | 2 - 3 | 1 - 3 | 1 - 4 |
| Lost | Bought a long time ago, average amount spent | 1 - 1 | 1 - 5 | 1 - 5 |
Segmented Customer Data
We can use the segmented data to identify
- best customers
- loyal customers
- at risk customers
- and lost customers
Once we have segmented a customer, we can take appropriate action to increase his/her lifetime value.
| customer_id | segment | rfm_score | transaction_count | recency_days | amount | recency_score | frequency_score | monetary_score | first_name | last_name | |
|---|---|---|---|---|---|---|---|---|---|---|---|
| Abbey O’Reilly | Potential Loyalist | 343 | 6 | 205 | 472 | 3 | 4 | 3 | Abbey | O’Reilly | abbey_o'reilly@rfmail.com |
| Add Senger | New Customers | 412 | 3 | 140 | 340 | 4 | 1 | 2 | Add | Senger | add_senger@rfmail.com |
| Aden Lesch | Loyal Customers | 323 | 4 | 194 | 405 | 3 | 2 | 3 | Aden | Lesch | aden_lesch@rfmail.com |
| Aden Murphy | Potential Loyalist | 544 | 7 | 98 | 596 | 5 | 4 | 4 | Aden | Murphy | aden_murphy@rfmail.com |
| Admiral Senger | Potential Loyalist | 433 | 5 | 132 | 448 | 4 | 3 | 3 | Admiral | Senger | admiral_senger@rfmail.com |
| Agness O’Keefe | Champions | 555 | 9 | 90 | 843 | 5 | 5 | 5 | Agness | O’Keefe | agness_o'keefe@rfmail.com |
| Aileen Barton | Champions | 555 | 9 | 84 | 763 | 5 | 5 | 5 | Aileen | Barton | aileen_barton@rfmail.com |
| Ailene Hermann | Potential Loyalist | 355 | 8 | 281 | 699 | 3 | 5 | 5 | Ailene | Hermann | ailene_hermann@rfmail.com |
| Aiyanna Bruen | About To Sleep | 321 | 4 | 246 | 157 | 3 | 2 | 1 | Aiyanna | Bruen | aiyanna_bruen@rfmail.com |
| Akeelah Walsh | Potential Loyalist | 445 | 7 | 160 | 779 | 4 | 4 | 5 | Akeelah | Walsh | akeelah_walsh@rfmail.com |
Let us quickly summarize the segments to get an overview of the number of customers, orders and average order value in each of them.
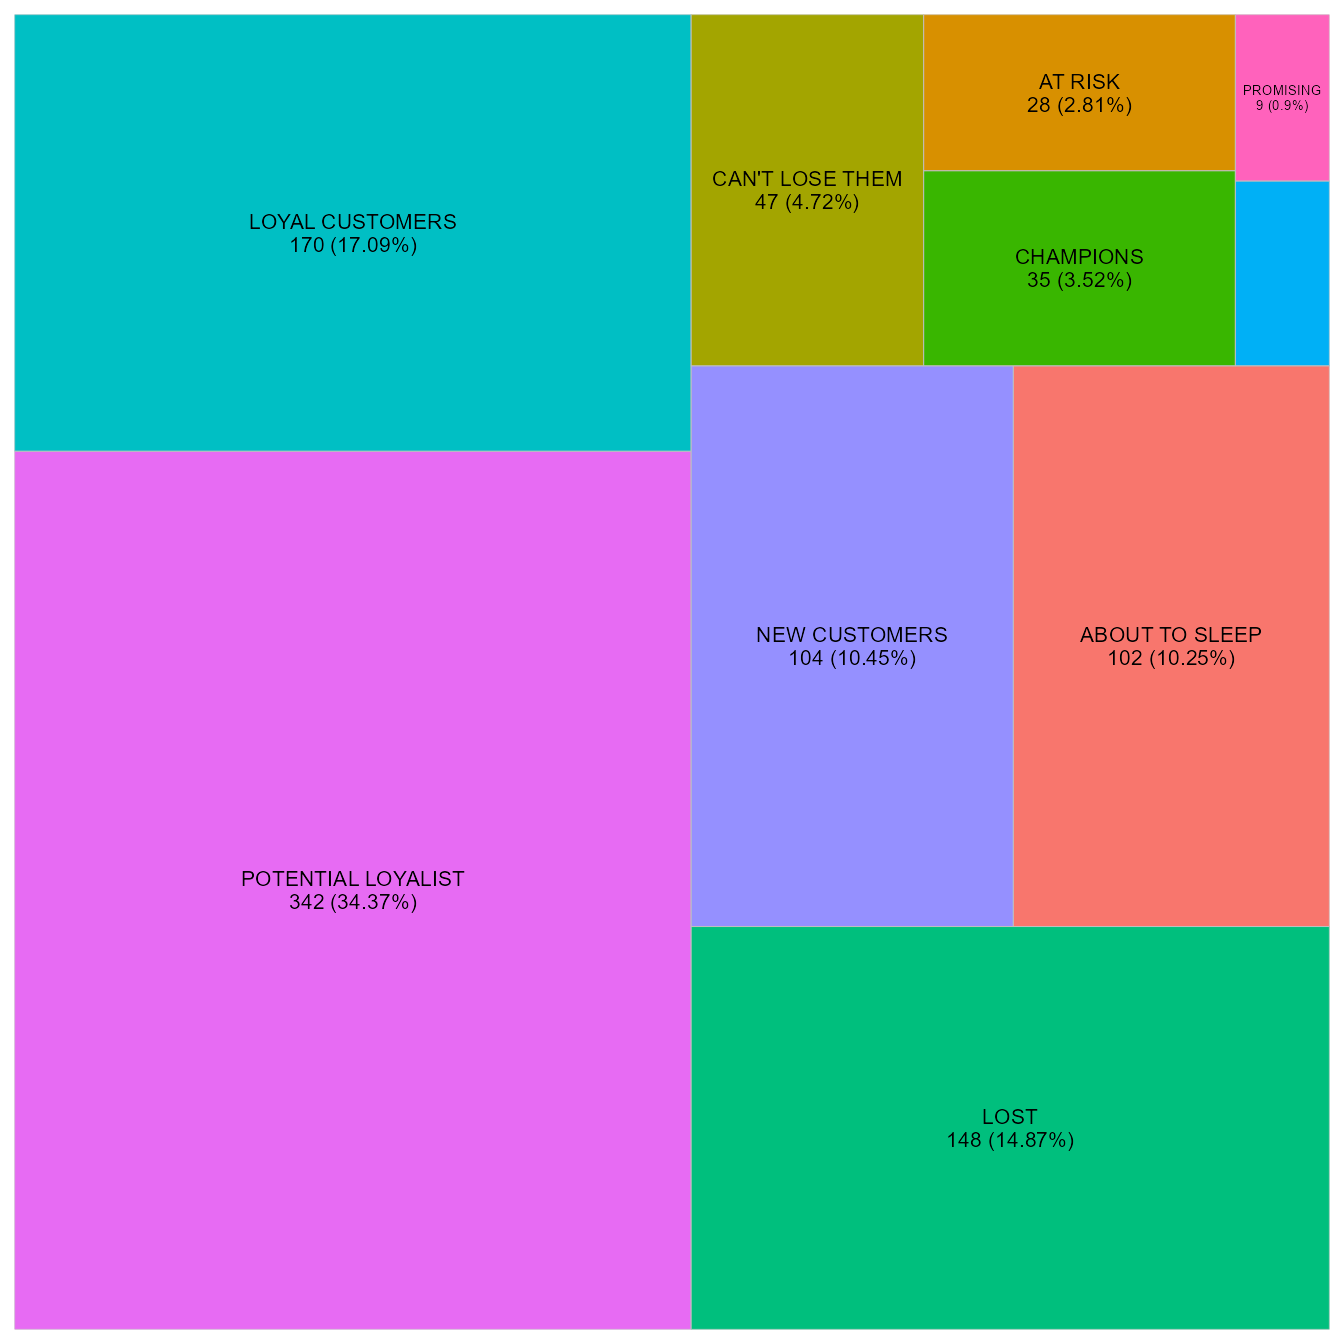
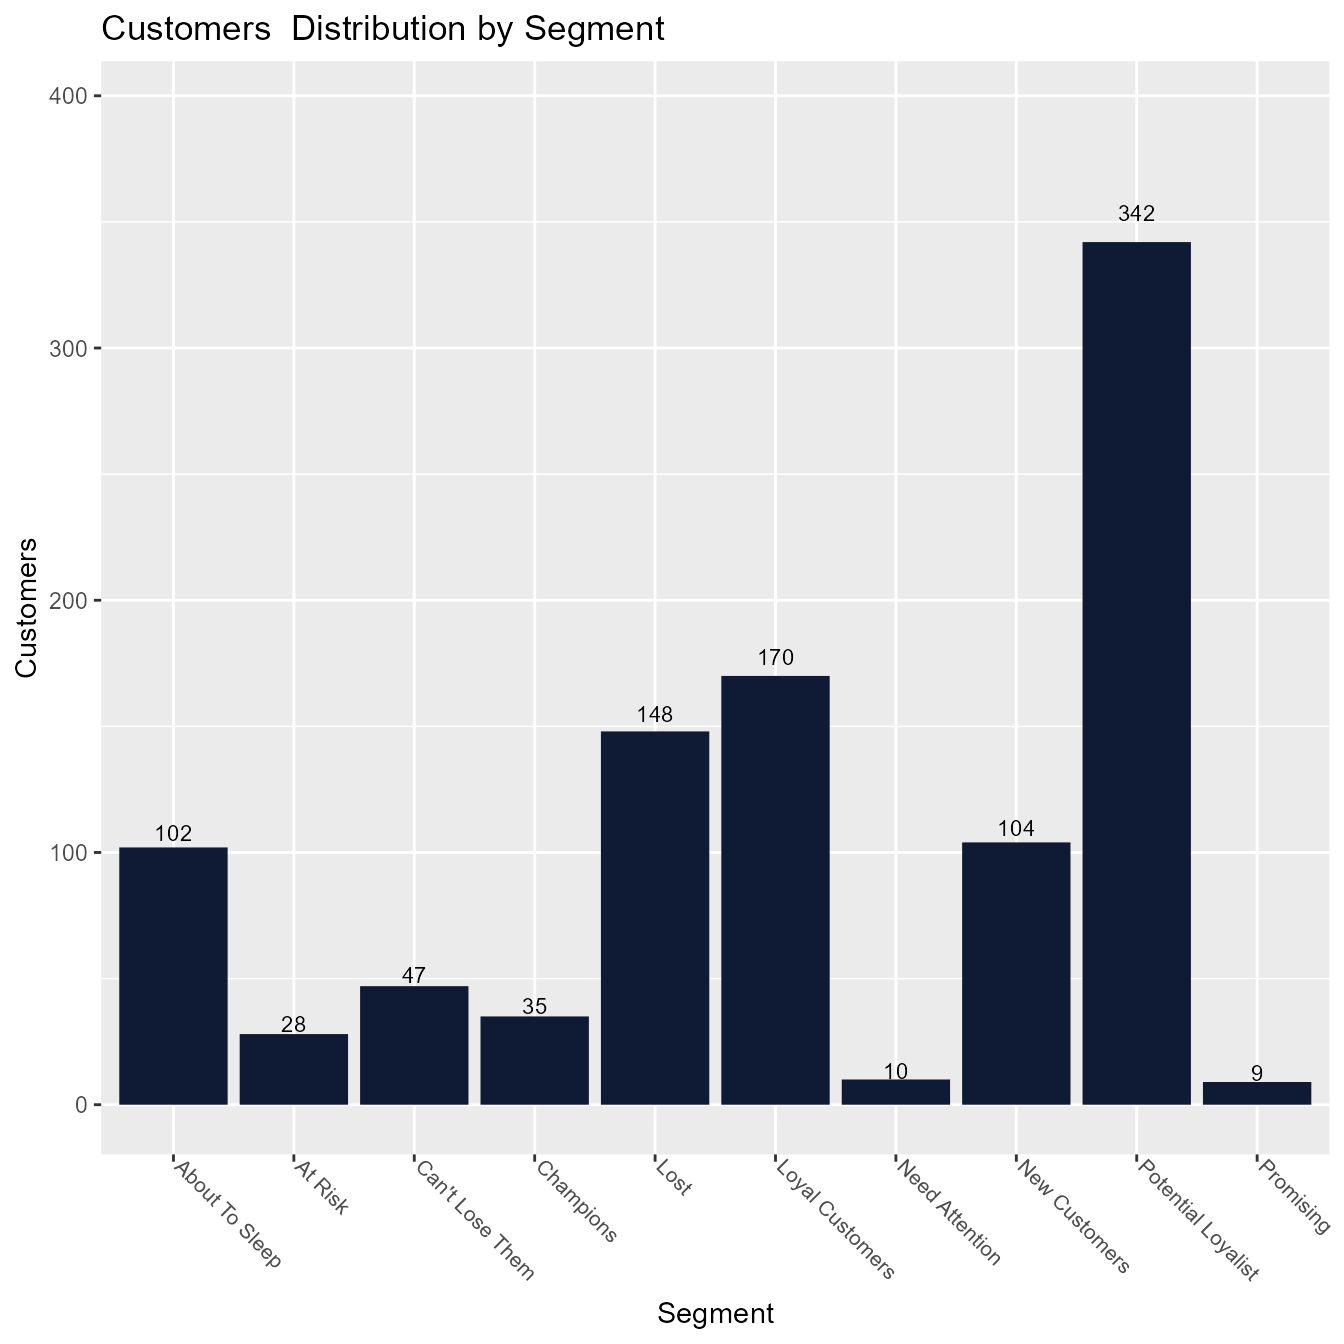
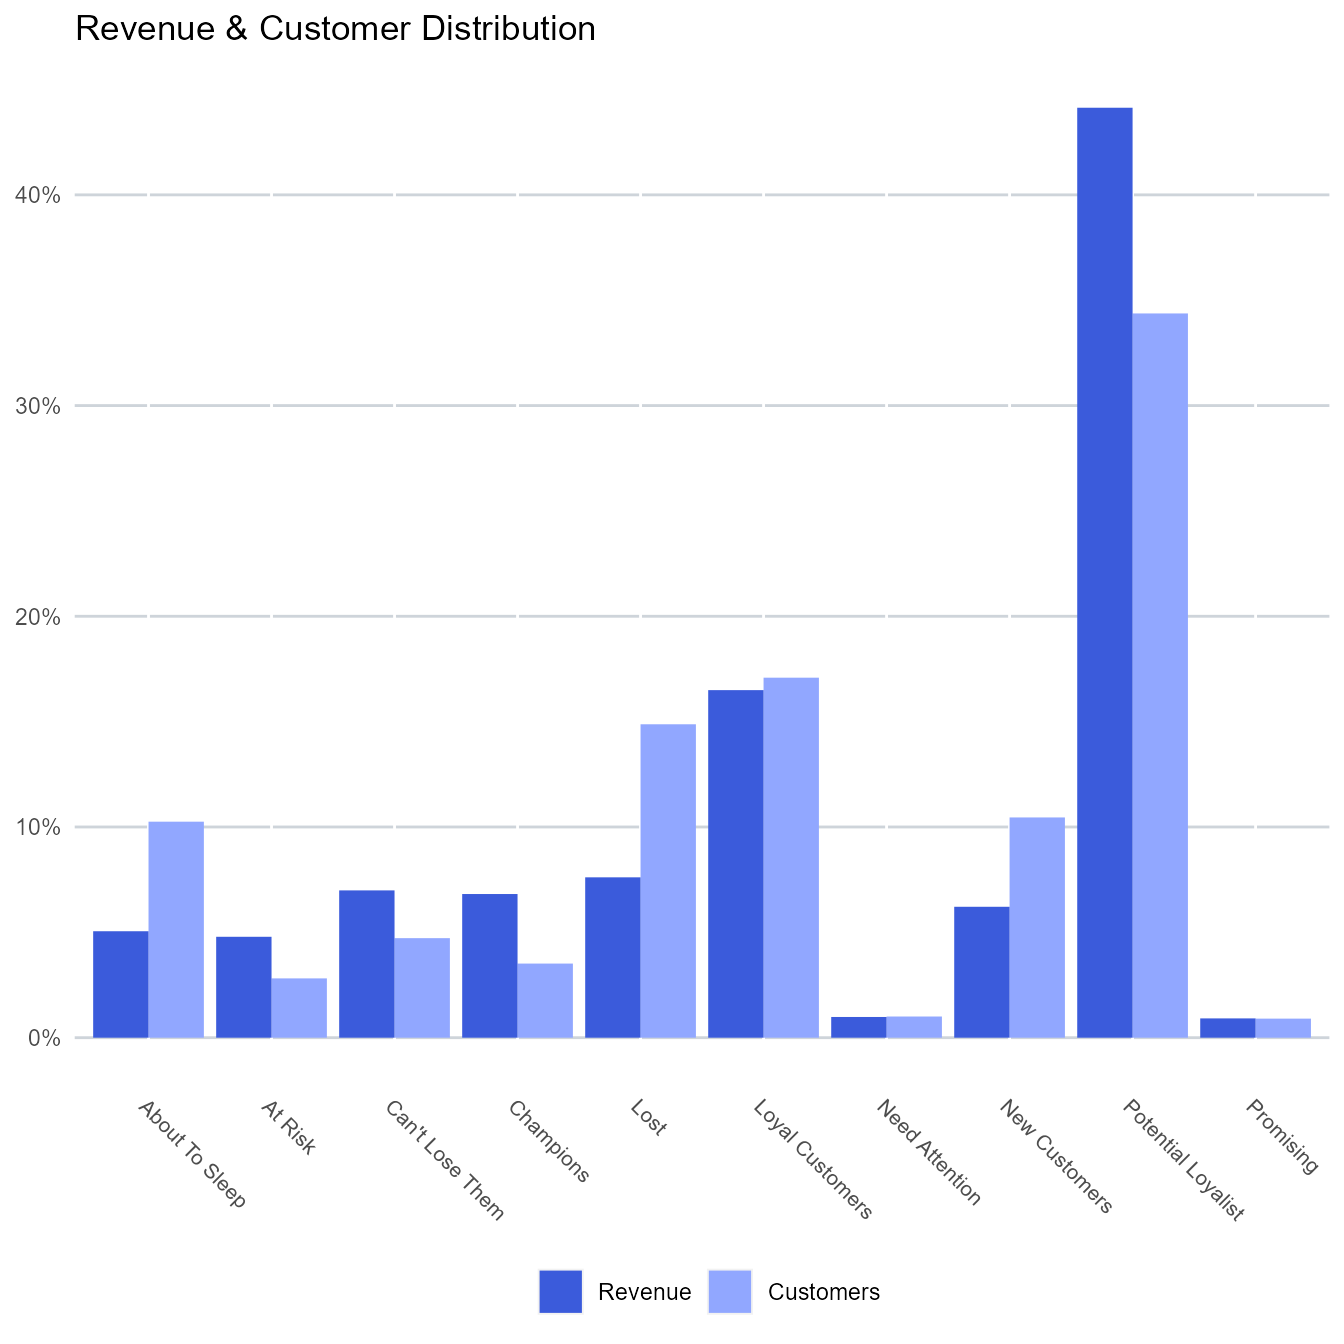
Segment Summary
rfm_segment_summary(segments)## # A tibble: 10 × 5
## segment customers orders revenue aov
## <chr> <int> <int> <int> <dbl>
## 1 About To Sleep 102 283 23449 82.9
## 2 At Risk 28 216 22227 103.
## 3 Can't Lose Them 47 274 32446 118.
## 4 Champions 35 316 31646 100.
## 5 Lost 148 393 35324 89.9
## 6 Loyal Customers 170 799 76562 95.8
## 7 Need Attention 10 57 4562 80.0
## 8 New Customers 104 329 28837 87.6
## 9 Potential Loyalist 342 2211 204856 92.6
## 10 Promising 9 28 4249 152.rfm package offers visualization tools to validate the
segments generated from the RFM score. Below are a few of them: